The widest eval + attack coverage in the category. One control plane.
245 scorers, 348 attack plugins, 91 providers — every number from the drift-checked registry. Six products behind one API key and one dashboard: evaluation, red teaming, firewall and gateway, observability and FinOps, compliance, and agents.
Proof, not promises
The widest coverage in the category — measured.
Our numbers come from the drift-checked registry and the published firewall benchmark. Competitor figures are hand-recorded from their public docs, the coverage donuts are control-map counts, and the load curve is a projection — each is labelled below. Hover any bar to read the count.
Eval scorers vs the field
Built-in, production-ready scorers — no custom authoring required.
built-in scorers
EvalGuard’s figure is the drift-checked registry. The three competitor counts are theirs, read from their public documentation on 2026-07-22 — the same verification pass /compare dates. They move when those vendors ship; we do not re-measure them for you.
Red-team plugins vs the field
Attack coverage across 100+ strategies and 30 categories.
attack plugins
EvalGuard’s figure is the drift-checked registry. Promptfoo, Garak and PyRIT are theirs, read from their public documentation on 2026-07-22; Garak publishes its probe count as “37+”, plotted here at its floor. Of our 102 strategies, 15 are adaptive — see the red-team chapter below for what that engine actually does.
Why p95 shouldn’t climb with load
Request path, all layers that run on it. The measured point is 3.67ms p95 over 20,000 runs; the curve is a projection.
Illustrative. The measurement behind it is one run: 20,000 sequential requests at ~388 req/s single-thread on 2026-08-10, published with its methodology at /trust/latency. Points beyond that throughput are projected from the pre-filter design, and the comparison curve is a generic in-band scanner, not a named product.
Platform breadth
One platform across the full lifecycle — where point tools cover a slice.
01 · Eval
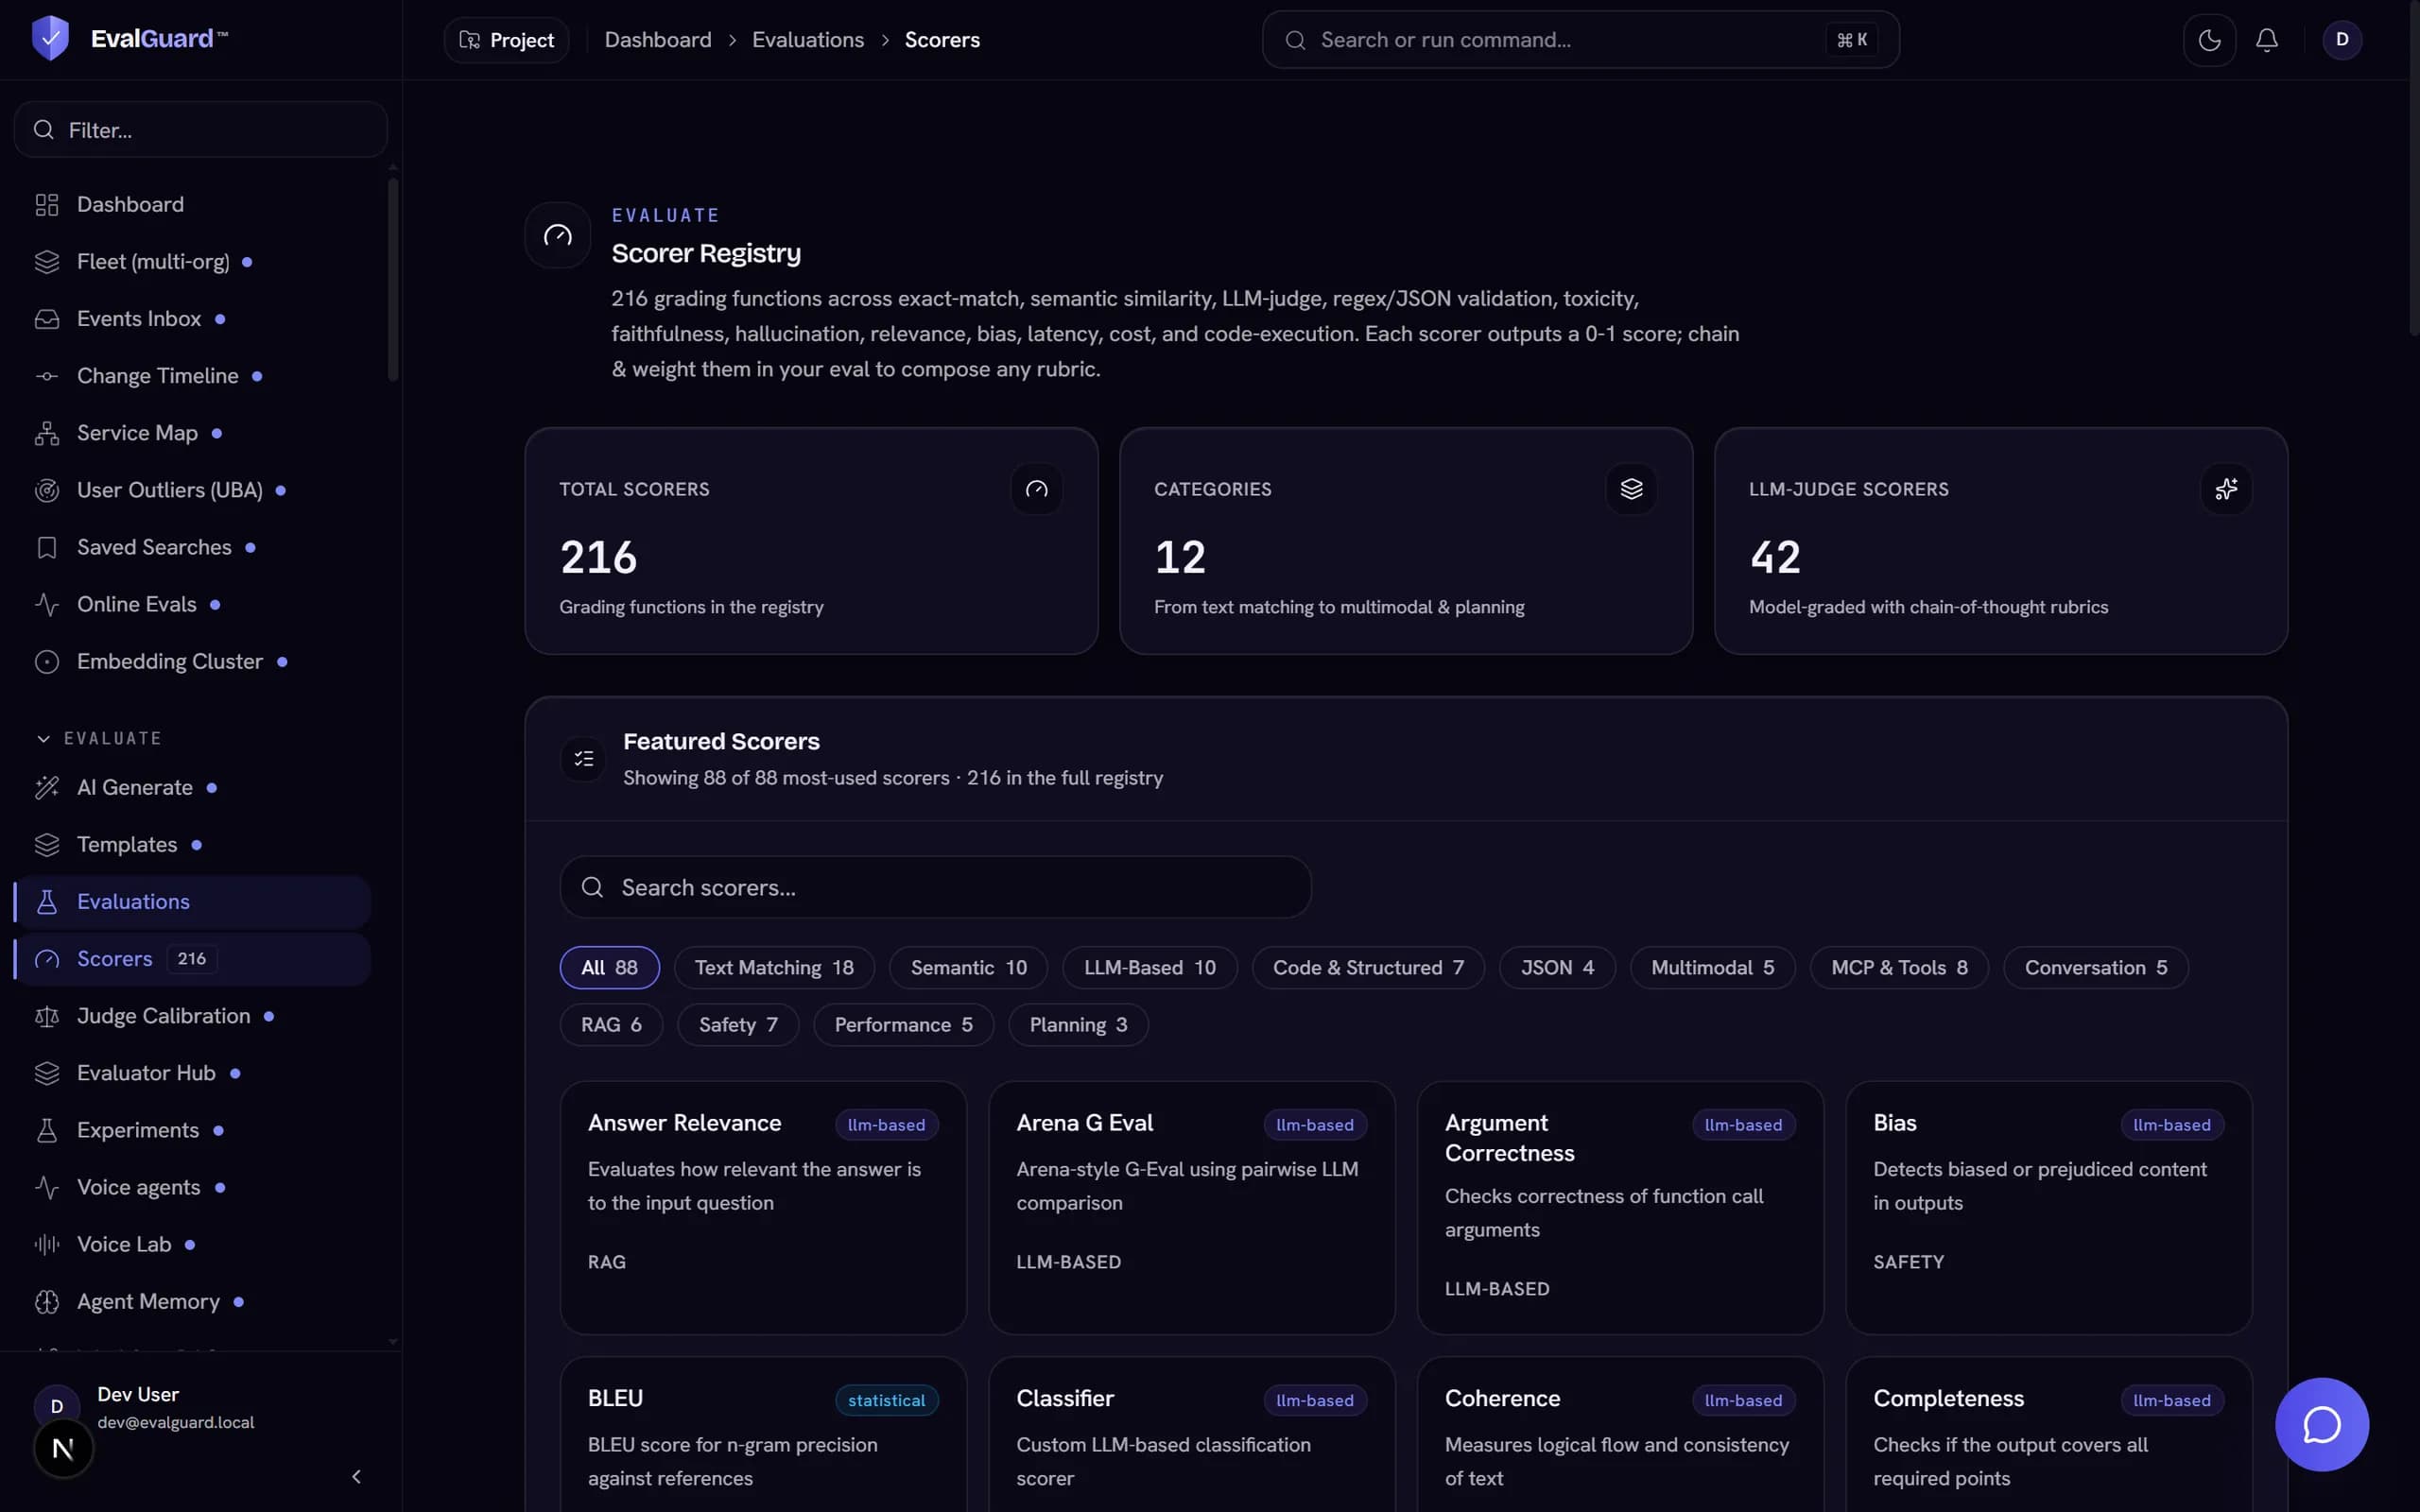
Describe your app in one sentence. 245 scorers take it from there.
The NL→Eval pipeline reads a plain-English description of your AI application, maps domain-specific risks, generates targeted test cases, and assembles a production-ready evaluation config. Healthcare, finance, legal: the risk mapping is compliance-aware from the first run.
- 34 benchmark suites plus custom LLM-as-judge and deterministic assertions
- 91 providers behind one interface, with a 121-model catalog switchable in one line of config
- Side-by-side model comparison with regression tracking over time
- Multi-model orchestration across 77 LLM providers
Also ships: a prompt registry — versioned prompts with side-by-side diffs, one-click rollback, and team approval workflows.
Open the full playgroundLive scorer · no signup
Real eval, not a mockup — same deep grader the production API runs.
02 · Red Teaming
348 attack plugins. 102 replayable strategies.
The catalogue is deterministic on purpose: every strategy is a transform you can re-run and diff. Layered on top, an opt-in multi-turn adversary probes the model across up to 10 conversation turns (15 max), reads its resistance, and reroutes with UCB1 bandit selection over its own strategy pool. Static test sets miss what an adaptive attacker finds.
- 102 strategies across 30 attack categories
- Prompt injection, jailbreak, PII and data-exfiltration probes
- Parallel attack sessions, each seeded from what already worked in earlier rounds
- Resistance profiling that re-aims the run at the weakest categories mid-scan
Also ships: a model-file scanner for pickle and safetensors — malicious opcodes and tampered tensors caught before the file ever loads, with ONNX and GGUF structurally audited alongside. Pure TypeScript; attacker code never executes.
Read the attack methodology03 · Firewall + Gateway
Request-path firewall clears in 3.67ms at p95.
Change one base URL and every LLM call routes through the gateway: input/output firewall, per-key rate limits, cost metering, and SSRF protection across 15 proxied providers. The latency figure is measured — 20,000 runs on 2026-08-10, on the request path — not claimed. The response-side scan is a second call whose cost scales with the response body; it is published separately, by size, at /trust/latency.
- Visual rule builder with semantic matching, regex patterns, and PII redaction
- Injection and PII screening on both prompts and responses
- Streaming support for all 15 proxied providers
- Reproducible benchmark: pnpm bench:firewall-latency --runs=20000
Also ships: Shadow AI detection (211 AI applications recognised, 20 of them governed by your own approve/restrict/block policy, plus credential-leak flags on outbound prompts), AI-SPM posture scoring with 12 misconfiguration checks, and agentless AI-BOM discovery against your own AWS Bedrock, GCP Vertex AI, and Azure OpenAI credentials.
Read the benchmark04 · Observability + FinOps
Every trace, token, and dollar, accounted per model.
OpenTelemetry-native ingestion turns agent runs into inspectable trajectories, and every request carries its own cost. Budgets, SLA targets, and drift alerts run on the same stream, so spend and quality never drift apart unnoticed.
- OTLP trace ingestion with cost breakdown per trace and per model
- Spend tracking per model, prompt, and team, with budget alerts and forecasting
- SLA targets you set and track on availability, latency P95/P99, error rate, and throughput
- Production drift monitoring that alerts on quality regression, with cooldowns and daily limits against alert fatigue
Also ships: a CISO-level risk dashboard — compliance scores, active incidents, and vendor risk on one screen.
See the tracing docs05 · Compliance + Governance
50 frameworks, mapped to evidence instead of screenshots.
Automated assessment across EU AI Act, NIST AI RMF, OWASP LLM Top 10, MITRE ATLAS, ISO 42001, India DPDP, HIPAA, and more. Risk classification, gap analysis, and audit-ready documentation generate from your actual runs, not from a questionnaire.
- EU AI Act risk classification with gap analysis and remediation plans
- Structured incident response: RCA templates for 11 AI failure categories, auto severity classification
- Vendor risk: 6-dimension assessments, DPA expiry alerts, lock-in scoring, pre-built profiles for OpenAI, Anthropic, Google, and Mistral
- A curated register of regulatory changes, plus a print-ready HTML report auditors can save as PDF
06 · Agents + Voice
Agents traced thought by thought. Voice included.
Distributed tracing for multi-step agents: every thought, action, and observation is a span with its own token count and cost. Voice agents run through the same pipeline, with word-level transcription and audio-deepfake detection instead of a separate voice stack.
- Agent trajectory visualization with RAG diagnostics and chunk attribution
- MCP traffic inspection: every tool call risk-scored in real time by the argument firewall
- Autonomy ladder L1–L4 with firewall-guarded deploys
- Voice-specific guardrails and latency evals on the realtime audio pipeline
Also ships: a results copilot that prioritizes findings by risk and drafts step-by-step fixes with code examples — today it runs on sample findings; wiring it to your own scans is in progress.
Build an agent on the canvasPlatform fundamentals
OpenTelemetry export · BYOK encryption · CI/CD templates · self-hosted Docker · Python SDK · OpenAPI docs
Run it against your own model.
The free tier includes 50,000 traces per month. Or get a walkthrough from the team.